Daily provides the most complete data and advanced BI tooling — from the largest set of metrics to enterprise-grade Looker dashboards and customization.
The most comprehensive analytics offerings
Get the insights that fit your team's workflows and needs
Developer Dashboard
Our free developer dashboard provides robust analytics on every session, participant, and track. Metrics and data include packet loss, bitrate, RTT, client logs, session data and more.
REST API — Logs and Metrics
Comprehensive metrics and client logs for every session via REST API. You can ingest this data into the tools of your choice. Available free to all accounts.
Enterprise Tooling
Access more data, powerful dashboards, and customization options with our integration with the Looker business intelligence platform. See highlights below.
Enterprise Analytics
More information, more workflow support
Daily understands that larger organizations require deeper access to usage and session quality data in order to support their data strategy and customer support and engagement across multiple teams.
- Firehose access to all of the data in your Daily domain, accessible within Looker
- Fast updates and large-scale data sets, via Looker's direct connection with our data warehouse
- In-depth visualizations out-of-the-box
- ETL wider company data, to produce custom reporting fusing other datasets
- Customization packages
Dashboard sample
Contact sales for a demo of our scores of visualizations.
Actionable information

User experience
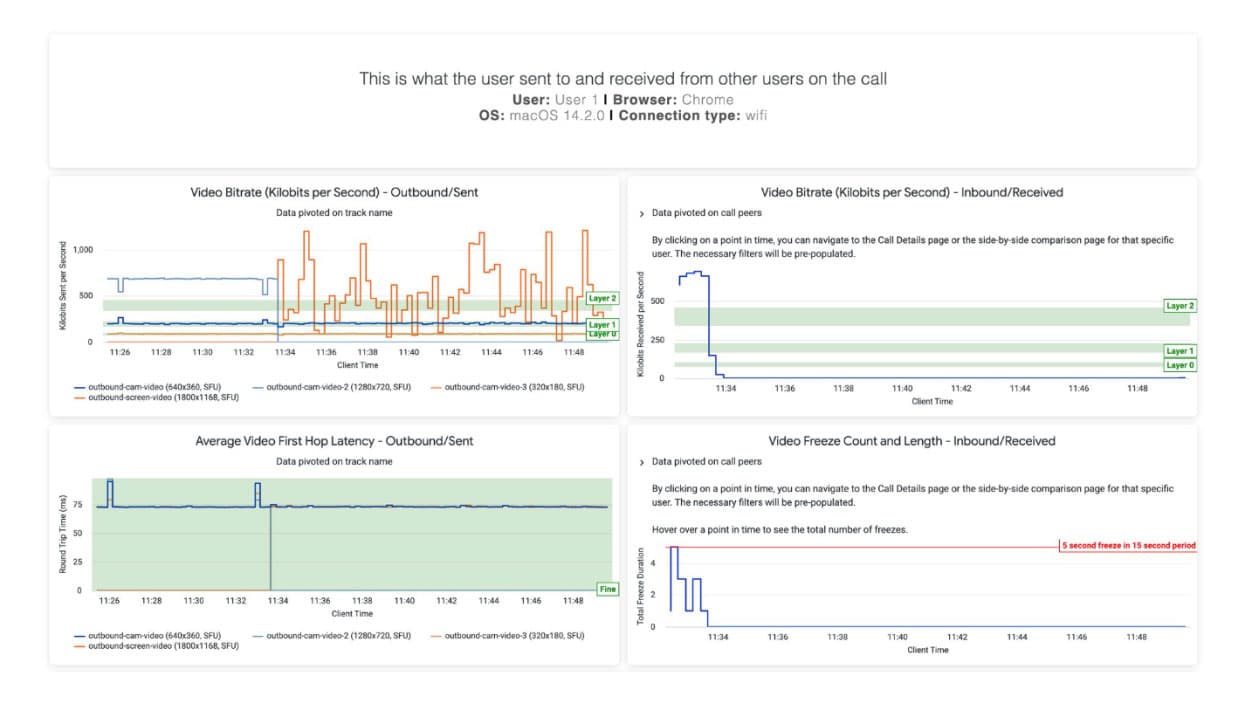
In addition to providing industry standard data like jitter and packet loss, we also work to deliver insights into how your end users experience the call. We provide information that maps onto user perception, as well as more data around key indicators.

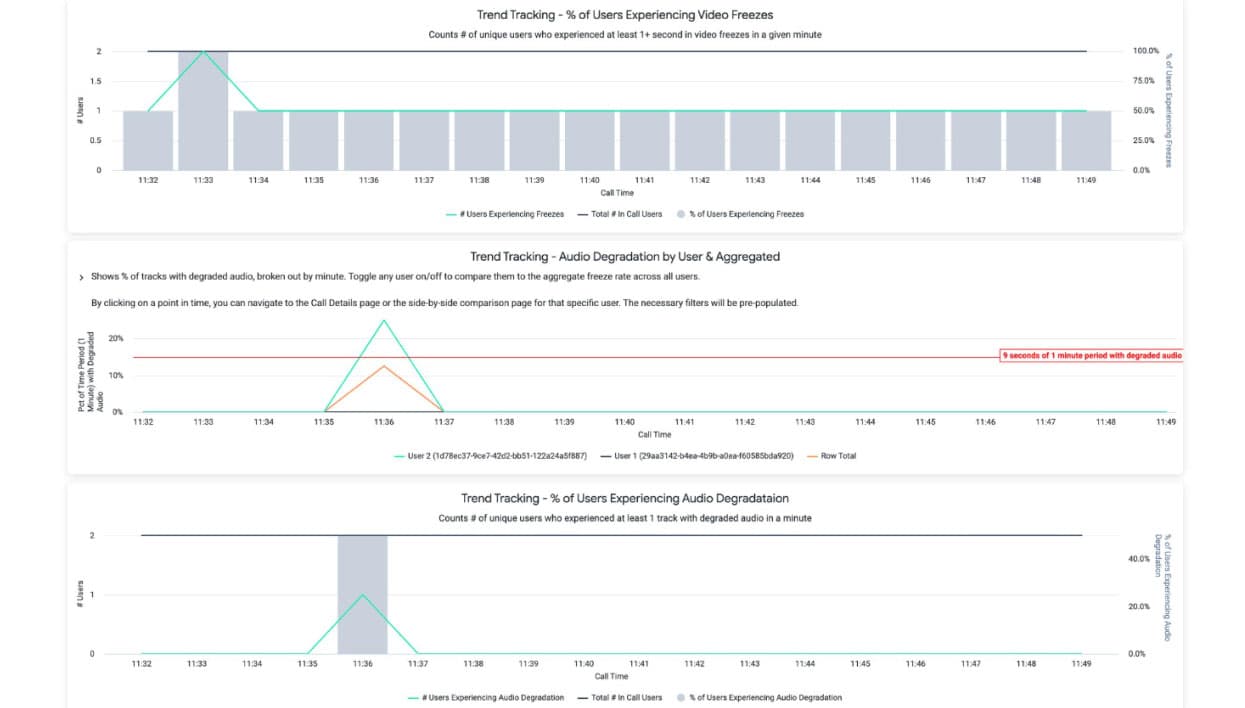
Freezes
Video freezes impact call quality — and specifically, map onto how users perceive the call and report the issue. (”They froze.”) We provide visualization on whether the browser detected a freeze or not.

Audio degradation
Our Audio Degradation metric tracks issues like robotic or out-of-sync audio, offering vital diagnostics on call quality. It equips customers with information to understand and address audio issues in their calls.

Network disruptions
Track call stability with Network Disruptions, highlighting transport and websocket disconnects. These indicators correlate directly with user experiences of video and audio issues, such as frozen video or dropped calls. It's an essential tool for diagnosing and understanding fluctuations in call quality metrics like bitrate and resolution.

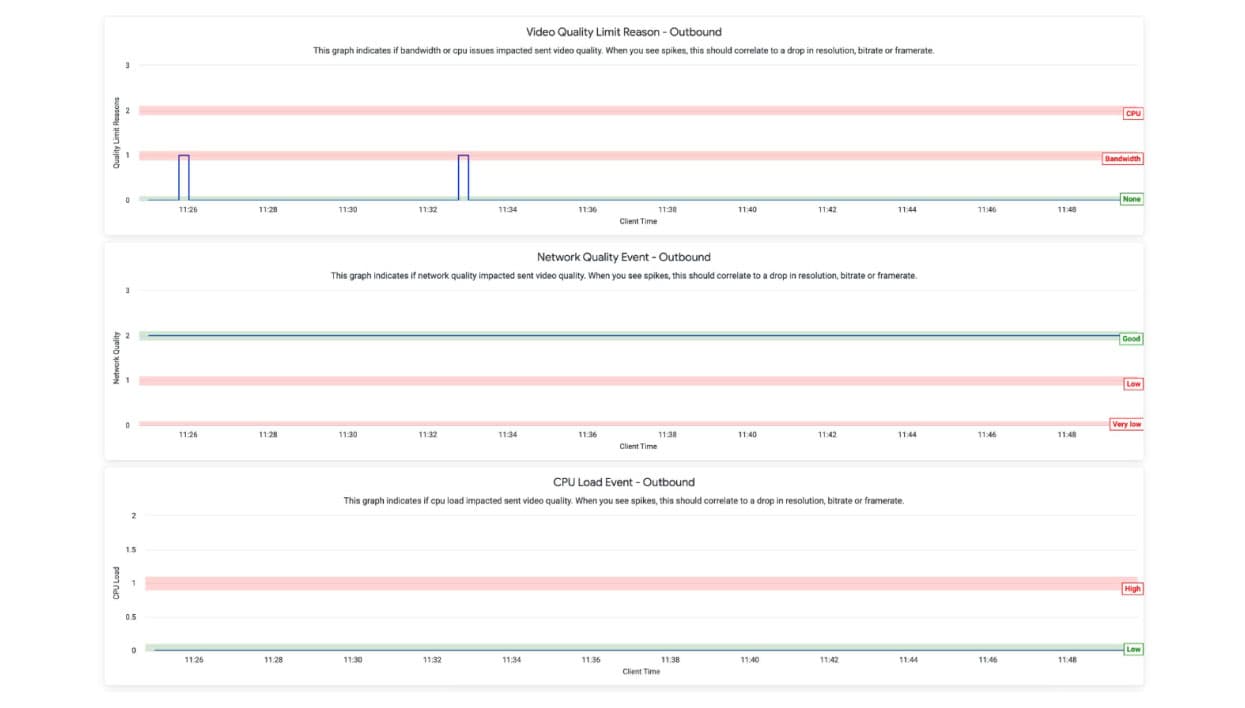
CPU load
Our CPU Load visualizations detects when high CPU usage impacts call quality, leading to issues like crackly audio, choppy video, and unresponsiveness. It's key for linking high CPU load to fluctuations in video resolution, framerate, and audio quality, offering insights into performance bottlenecks.

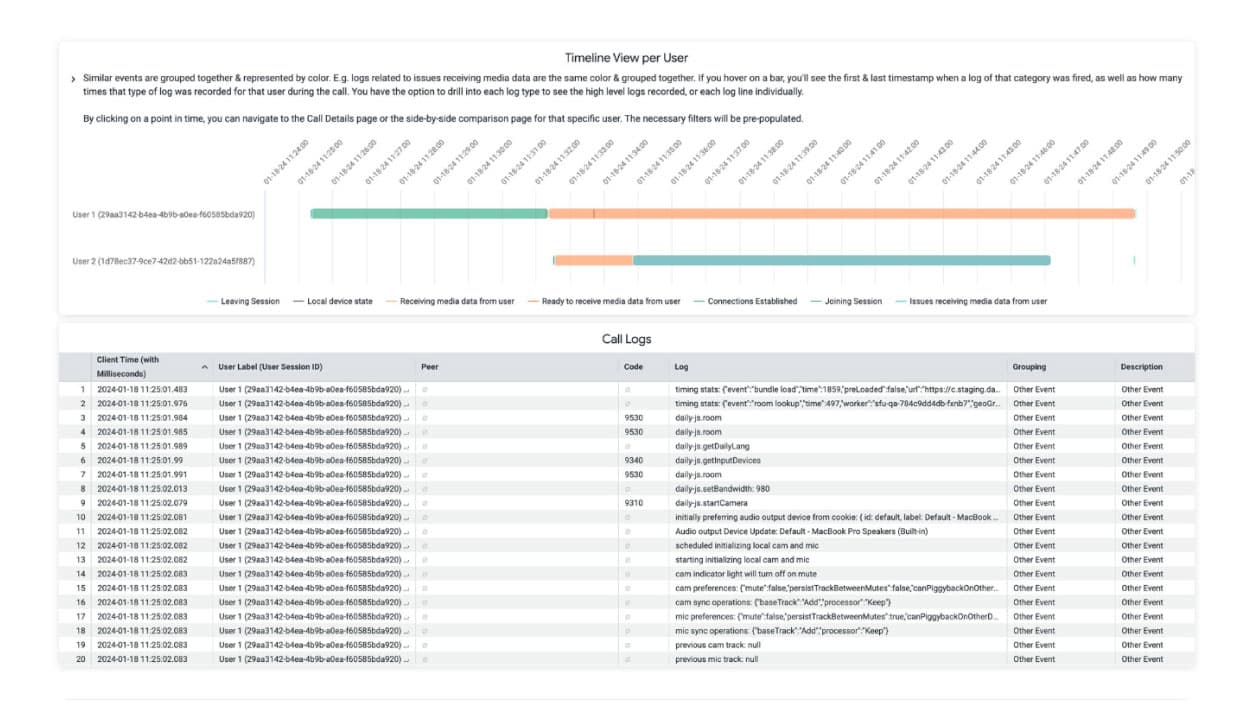
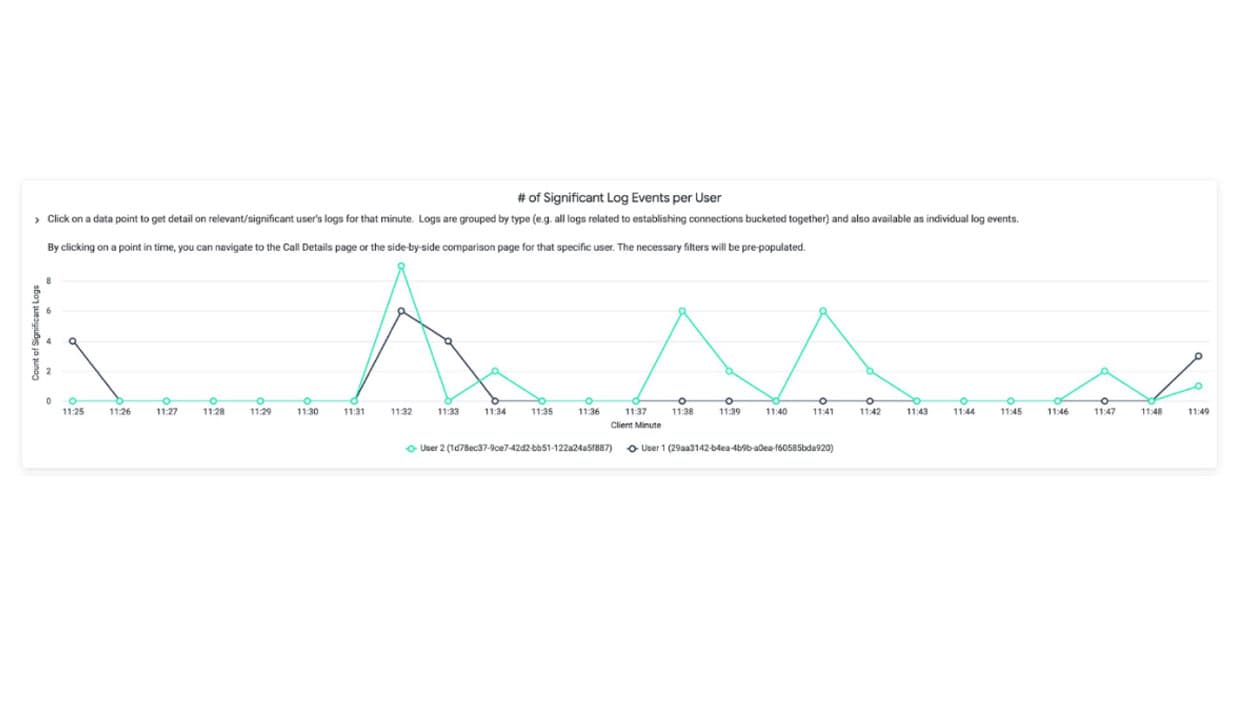
Issue clusters
Significant client logs let you see clusters by issue categories on the call. This lets your team get insight into problem areas of a call. These include media device errors, connection issues, application issue, and more.

Timeline view per user
Significant client logs let you see clusters by issue categories on the call. This lets your team get insight into problem areas of a call. These include media device errors, connection issues, application issue, and more.
Designed for enterprise workflows, based on expertise
Decades of leadership
Learn about our decades-plus experience building video for the Fortune 100. Our executive leadership includes the coauthor of WebRTC analytics specifications.
Data for every need
Gain insights to power all your workflows — from streamlined views to enable swift support; debugging and hardware analysis; trends and usage insights, and more.
Observability roadmap
Contact sales to learn about our continued investment in analytics. We’re glad to discuss our roadmap for 2024.
Customized dashboards
Get the insights you need with our dashboard customization offering.