


Intro
As you’re probably already tired of hearing, 2020 has been an unprecedented year for online video. With this surge of new users and use cases, comes an incredible diversity of devices, networks, and operating conditions. More and more people are engaging with real-time video products, and they are doing it in new and novel ways.
The other side of this proliferation is that those who are building real-time video products are bound to experience more complex debugging scenarios. Maybe you have a house full of college students doing e-learning over spotty WiFi, a busy parent checking in on their child’s remote school session from their phone, or large groups of people watching a live concert from all over the world. Developers need the ability to diagnose the real-world problems of their users so that they are empowered to fix them as quickly as possible.
What’s new?
In service of solving these problems, and accelerating developer time to value, we are very excited to announce the launch of the /logs API endpoint. In addition to our new dashboard features which provide similar insights, you will now have the ability to dive even deeper into the underlying data. It also means you can use this data in your existing systems of record for logging and metrics. To show what is possible with this data, we built Daily Call Explorer, a Google Colab hosted IPython Jupyter notebook.
Captain’s log
At the heart of our latest release is the /logs endpoint. It allows you to dig into call logs and metrics to truly understand participant experience. Call logs provide a record of the events that take place during a call. Call metrics are WebRTC stats that help you understand and characterize video call quality and performance.
To get started, all you need is an API key, which you will find on your Daily dashboard.
Let’s curl the endpoint to get some sample data:
curl --request GET \
  --header 'authorization: Bearer $YOUR_API_KEY \
  --url 'https://api.daily.co/v1/logs?mtgSessionId=7a99abff-0047-4b27-c6c1-49b4ec46f1de&userSessionId=4fde3659-71f6-4c28-9a90-e4c3f08ca611&includeMetrics=1'
Note: we’re providing
mtgSessionId,userSessionId, andincludeMetricsparameters. Read more about available parameters here.
The response will look something like this:
{
   "logs":[
      {
         "time":"2020-09-29T18:01:41.791Z",
         "clientTime":"2020-09-29T18:01:26.529Z",
         "message":"participant joined",
         "mtgSessionId":"7a99abff-0047-4b27-c6c1-49b4ec46f1de",
         "userSessionId":"4fde3659-71f6-4c28-9a90-e4c3f08ca611",
         "peerId":"6cfbb8ec-fdbe-49f4-8a7d-39167f5c7745",
         "domainName":"markstaging",
         "level":1,
         "code":8010
      },
      "..."
   ],
   "metrics":[
      {
         "time":"2020-09-29T18:20:07.094Z",
         "clientTime":"2020-09-29T18:20:05.446Z",
         "mtgSessionId":"7a99abff-0047-4b27-c6c1-49b4ec46f1de",
         "userSessionId":"4fde3659-71f6-4c28-9a90-e4c3f08ca611",
         "roomName":"logger",
         "domainName":"markstaging",
         "videoRecvPacketLoss":0,
         "userRecvBitsPerSecAvg":1038950,
         "userRecvBitsPerSecMax":1248527,
         "userRecvBitsPerSecMin":702322,
         "userSentBitsPerSecAvg":1059720,
         "userSentBitsPerSecMax":1087262,
         "userSentBitsPerSecMin":1039595,
         "metrics":{
            "6cfbb8ec-fdbe-49f4-8a7d-39167f5c7745":{
               "transport":{
                  "bitsSentPerSecAvg":1059720.499904,
                  "bitsSentPerSecMax":1087262.194208,
                  "bitsSentPerSecMin":1039595.375608,
                  "recvPacketsLostPct":0,
                  "bitsReceivedPerSecAvg":1038950.203992,
                  "bitsReceivedPerSecMax":1248527.009696,
                  "bitsReceivedPerSecMin":702321.618656
               },
               "inbound-cam-audio":{
                  "jitterAvg":0.0057,
                  "jitterMax":0.039,
                  "packetsLostPct":0,
                  "bitsReceivedPerSecAvg":13496.145309,
                  "packetsReceivedPerSecMax":50.029943,
                  "packetsReceivedPerSecMin":31.997887,
                  "jitterBufferDelayPerEmittedCountAvg":0.052572
               },
               "inbound-cam-video":{
                  "packetsLostPct":0,
                  "qpsumPerFrameMax":32.174712,
                  "qpsumPerFrameMin":32.133797,
                  "bitsReceivedPerSecAvg":932571.759686,
                  "decodeTimePerFrameAvg":0.003017,
                  "packetsReceivedPerSecMax":142.475773,
                  "packetsReceivedPerSecMin":79.994717,
                  "jitterBufferDelayPerEmittedCountAvg":0.048182
               },
               "outbound-cam-audio":{
                  "bitsSentPerSecAvg":14000.112027,
                  "packetsSentPerSecMax":50.029943,
                  "packetsSentPerSecMin":49.98208,
                  "remoteInbound-jitterAvg":0.00264,
                  "remoteInbound-jitterMax":0.002771,
                  "remoteInbound-packetsLostTotal":0,
                  "remoteInbound-roundTripTimeAvg":0.0042
               },
               "outbound-cam-video":{
                  "qpsumPerFrameMax":39.631361,
                  "qpsumPerFrameMin":39.469008,
                  "bitsSentPerSecAvg":987876.640172,
                  "packetsSentPerSecMax":130.953051,
                  "packetsSentPerSecMin":123.498025,
                  "encodeTimePerFrameAvg":0.004297,
                  "remoteInbound-jitterAvg":0.009012,
                  "remoteInbound-jitterMax":0.010833,
                  "remoteInbound-packetsLostTotal":0,
                  "remoteInbound-roundTripTimeAvg":0.0055
               }
            }
         },
         "isSFU":false
      },
      "..."
   ]
}
You will notice two distinct top-level properties here: logs and metrics (included because of the includeMetrics=1 parameter).
Let’s look at those in a bit more detail. First up: logs.
Each of the items will have the following properties:
| time | UTC time of collection |
| clientTime. | UTC time of client reports |
| message | Short description of a discrete event or error |
| mtgSessionId | Session’s unique ID |
| userSessionId | User’s unique session ID |
| peerId | Peer connection’s `userSessionId` |
| domainName | Domain hosting the call |
| level | Log level (error:0, info:1, debug:2) |
| code | Optional (used for internal storage) |
Metrics reporting for duty
Next up, let’s look at metrics.
Each json blob in the array will have the following properties:
| time | UTC time of collection |
| clientTime | UTC time client reports |
| userSessionId | User’s unique session ID |
| mtgSessionId | Session’s unique ID |
| roomName | Room name |
| DomainName | Domain hosting the call |
| VideoRecPacketLoss | % packet loss (worst value from all pairs) |
| userRecvBitsPerSecAvg | Avg receive transport bitrate (bps) |
| userRecvBitsPerSecMax | Max receive transport bitrate (bps) |
| userRecvBitsPerSecMin | Min receive transport bitrate (bps) |
| userSentBitsPerSecAvg | Avg send transport bitrate (bps) |
| userSentBitsPerSecMax | Max send transport bitrate (bps) |
| userSentBitsPerSecMin | Min send transport bitrate (bps) |
| metrics | JSON blob |
| isSFU | Call mode (boolean) (SFU or P2P) |
Note for the child
metricsblob there will be a slightly different structure depending on the call mode. The example response above represents p2p mode. You can see a sample SFU mode response here.
Now that you’re familiar with all of the data at your disposal, let’s look at how we can use it.
Become an explorer
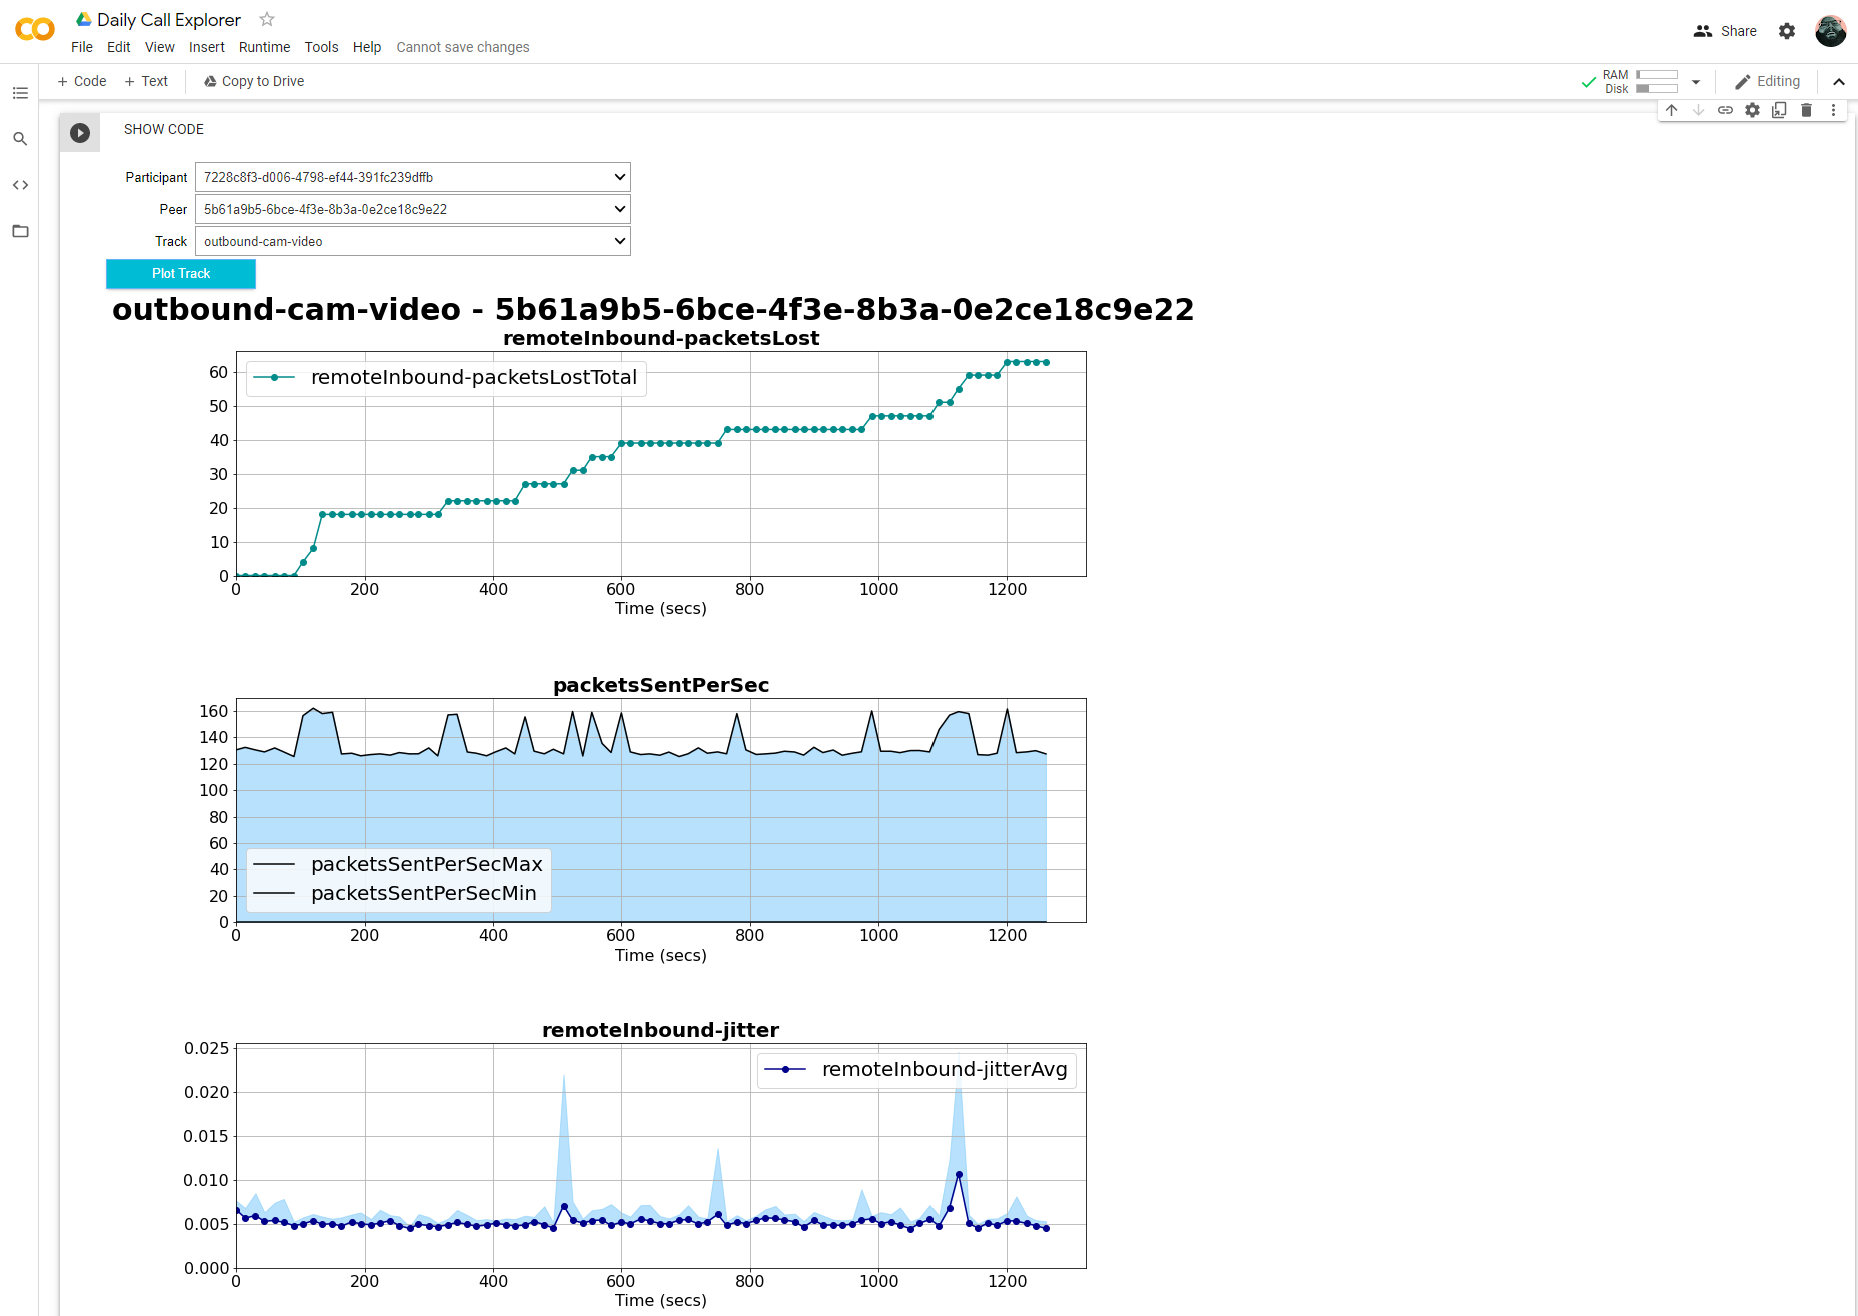
As an example of a way to harness the call metrics information for yourself, we've built a sample app — the Daily Call Explorer, a Google Colab hosted IPython Jupyter notebook.
You can use this sample app to see your track level information between participants and their candidate-pair. Open the Daily Call Explorer and follow the instructions at the top to get started.
To make sure it works for everyone, we’ve made it read-only. If you’d like to change the code to inspect or extend the tool, please make a copy of the notebook using File→Save a copy….
We will be adding track level data to the Daily Dashboard in the future, but this notebook will continue to serve as a great introduction to using our API to find highly detailed logs and metrics about your calls.
Troubleshooting
If for some reason you’re not seeing logs and call stats for a particular user, it’s possible that their browser is using an older bundle of our call machine code. To confirm, they should see logging and telemetry enabled in the console when the call starts. If they are not seeing this, have them clear their cache and try again, and if that still doesn’t work then please reach out.
What’s next?
We hope that access to all of this logging and metrics data empowers you to continuously improve your customer experiences. Perhaps you can integrate it into your existing logging and metrics infrastructure. If you’re just getting started there, we will have content coming soon to guide you through that process.
Never miss a story
Get the latest direct to your inbox.