

If you’re reading this post in 2020, then the odds are high that you’ve been on a lot of video calls this year. And that means that more than once you’ve probably experienced the frustrations that accompany low quality video calls: delayed audio or video, blurry screens, patchy connections, to name a few. In order to avoid these hiccups, it’s useful to monitor call performance to improve apps.
Developers building with our Daily video chat APIs can use our prebuilt UI or build their own custom video chat layout. Both support ways to gain insights into call performance.
We built a network tab in the Daily prebuilt UI to show how the video chat adapts to the local network conditions. Daily calls work well even on networks with limited bandwidth and high packet loss, and the network tab gives users some insight into what's happening under the hood. Call participants can see packet loss, download rate, and upload rate.

If you’re a developer building on top of the Daily call object, you can monitor for several network events and build your own monitoring panel.
While we built these tools for monitoring network performance, we’re also often curious about how the performance of the code in the demo apps we build might impact the quality of our calls. We realized other developers building on Daily might also be asking this question.
Enter stats.js!

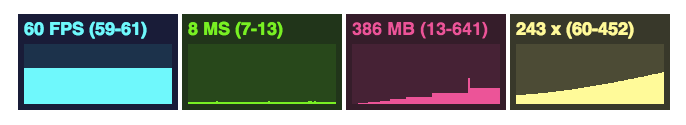
Stats.js is a JavaScript performance monitor that tracks:
- Frames per second (FPS): a low number means there’s something we should change.
- Milliseconds needed to render a frame (MS): a high number signals we should make some updates.
- MBytes of allocated memory (MB): Run Chrome with --enable-precise-memory-info.
To use, create a new bookmark, saving this bookmarklet as the URL:
javascript:(function(){var script=document.createElement('script');script.onload=function(){var stats=new Stats();document.body.appendChild(stats.dom);requestAnimationFrame(function loop(){stats.update();requestAnimationFrame(loop)});};script.src='//mrdoob.github.io/stats.js/build/stats.min.js';document.head.appendChild(script);})()Then, navigate to your web app, and click on the bookmark. When you do, the panes will display and you can click through to see the different stats.

If you test this out in your projects, let us know what you think! In the meantime, stay tuned for more updates about monitoring Daily call performance.
Never miss a story
Get the latest direct to your inbox.